As many of you will know, by now, I'm a big fan of Reflector. I've used it for quite some time, since its early days as a piece of freeware developed by Lutz Roeder, and overall it's proven to be an extremely valuable tool. When a UK-based company, Red Gate Software, acquired the Reflector technology back in 2008, I was curious as to their strategy for monetizing it (and it seems I wasn't alone in speculating on the direction the tool would take as a commercial offering). Well, that's now starting to become clear with the Beta release of .NET Reflector Pro.
Here's the tag-line on Red Gate's website for this new version:
.NET Reflector Pro integrates .NET Reflector into Visual Studio to allow you to seamlessly debug into third-party code and assemblies, even if you don't have the source code for them. You can now treat decompiled assemblies much like your own code: you can step through the assemblies and use all the debugging techniques that you would use on your own code.
This blog article on Red Gate's Simple-Talk site contains some more interesting details on this version's capabilities. Here are the two main features:
- Letting you jump to Reflector from your code (this is free!)
- Debugging decompiled code using the visual studio debugger (this is Reflector Pro - so will cost money)
Both of these items look pretty interesting, and – knowing that the .NET API for AutoCAD is unobfuscated, as it's mostly a fairly thin layer on top of ObjectARX – the second (paid) feature has the potential to be of great interest to AutoCAD .NET developers.
So I decided to put the tool through its paces. After downloading the most recent external Beta (build 892), and extracting it to my hard-drive, I launched Reflector.
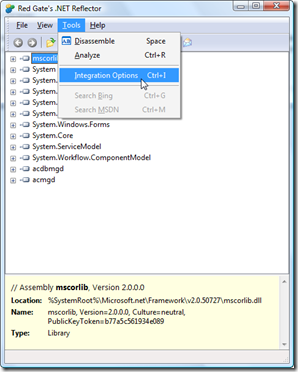
On the Tools menu, we see the Integration Options menu item:
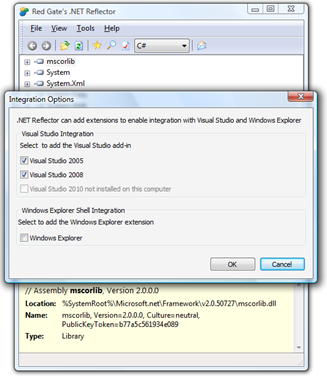
In the options, themselves, we can see that the tool has detected the installed versions of Visual Studio on my system and has integrated itself appropriately with them:
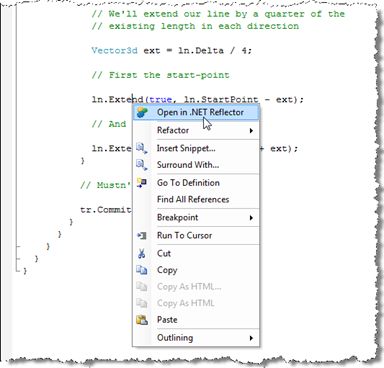
Now, as long as we've previously loaded AutoCAD's managed assemblies inside Reflector (File –> Open, and select "acmgd.dll" and "acdbmgd.dll" from our AutoCAD installation folder), we should now be able to jump directly to the implementation of a particular method from the Visual Studio window. Let's take the example of the method looked used in the last post, the Extend method we called on a Line:
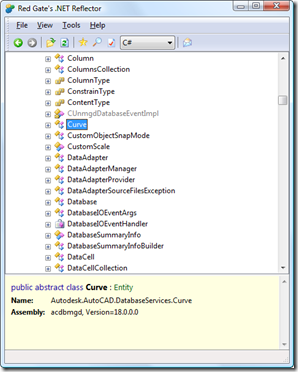
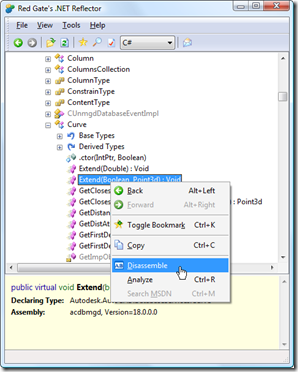
And when we select it, the integration takes us to the Curve class in Reflector:
From here it's a manual operation to expand the class and select "Extend(Boolean, Point3d) : Void" from the list of methods (although I'm curious why it didn't manage to get there itself – perhaps a minor Beta quirk).
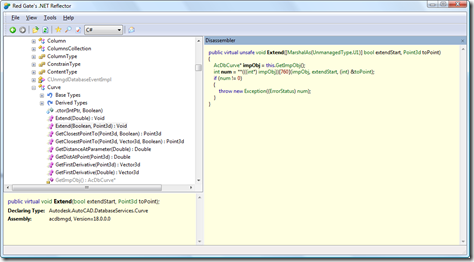
And then we can, of course, use the standard Reflector capabilities to look into the code:
Which admittedly only shows us (in this case, at least) an obscure piece of code which is actually calling through to the underlying, unmanaged, ObjectARX API:
In the second part of this two-part series, we'll take a look at the "Pro" features of this new .NET Reflector version: the actual debugging integration.
Leave a Reply